Blog: Power-Saving Issues Exacerbated by Meaningless Metrics
Article By : Bill Schweber
There are so many conflicting and error-laden numbers available about energy sources and consumption that making sense of it is a challenge.
Power use and energy savings for both battery- and line-powered devices are major topics, of course. As a consequence, there are many decisions to make about where to invest, the return on investment, applied time and effort, component selection, and more. Of course, to make these decisions, we need credible data.
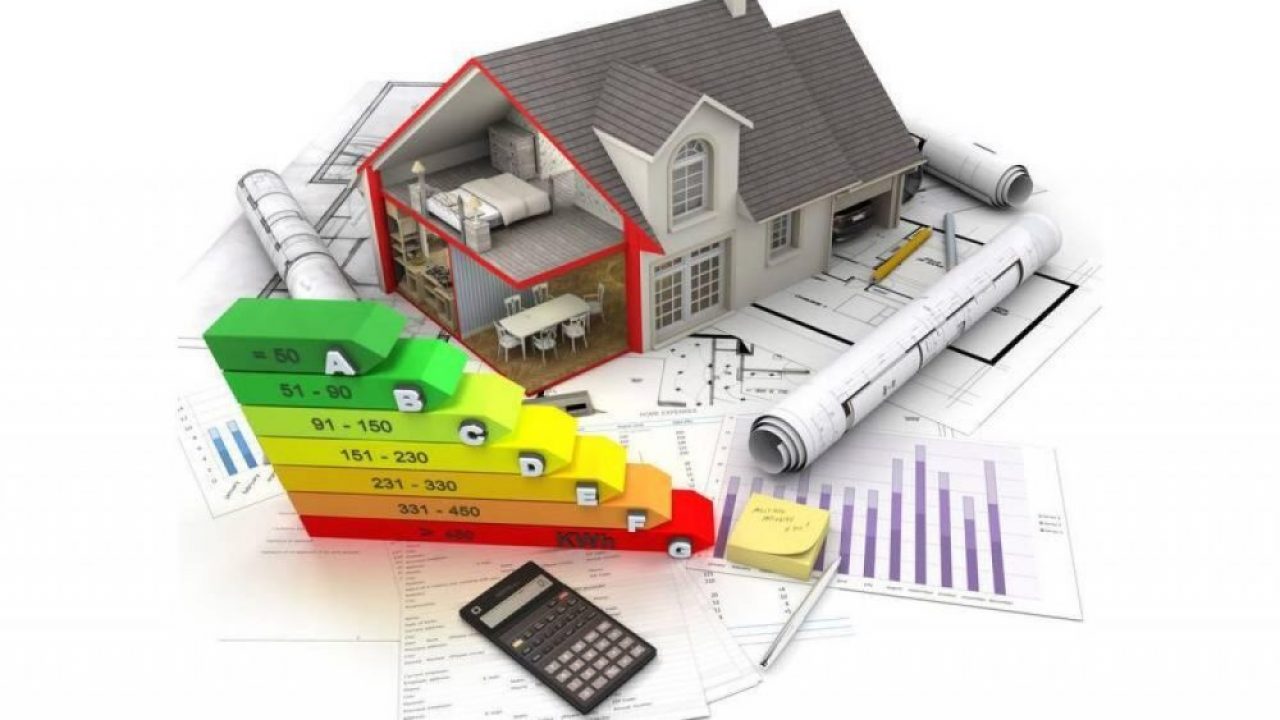
But credible data on energy sources and use is often hard to assess (Figure), and the difficulty is not helped by well-intentioned but meaningless missives. Every month I get a letter from our local electric utility, comparing the energy of our house to our various neighbors. A typical letter reads “your electricity use last month was XX% above (or below) that of your neighbors.”
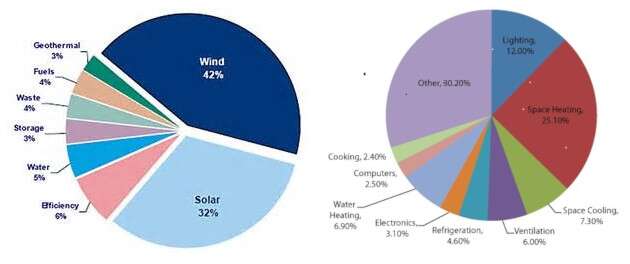
These are just two of the many charts available claiming to show US renewable energy sources (left) and how used (right) with the latter numbers for commercial buildings (both charts for 2016); if you don’t like the numbers you see, just keep looking and you’ll find many other statistics to use, instead. (source: http://www.energystar.gov)
To which I say “OK, so what?” The woman who is on one side of my house is often away at her vacation home, while the family on the other side has four children. This precise statistic is completely useless, and a waste of the time and money used to collect, print, and mail it. I suspect it makes someone, somewhere feel good that they are informing me of this “fact” but making yourself feel good is not a sufficient rationale for this misleading waste.
Since I started getting this monthly energy update about a year ago, I have been watching some of the energy-usage claims I have seen, often unattributed (or very sketchy, even if there is a reference). One source claims home lighting was responsible for 13% of US energy use, while another said that electric motors used 83%. When you start adding up these claims, it’s easy to reach at least 150% and maybe as much as 200% of actual energy use. Conversely, once you figure out the inevitable overlap across the broad categories, the data probably covers only half to three-quarters of the actual picture. Either way, here’s lots of margin in these numbers, though you would never know that by how they are stated.
Sometimes the providers of these numbers are looking at things from a very simplistic perspective; sometimes they take numbers out of context; other times they are deliberately being selective in order to promote an agenda. It’s hard to know which characteristic applies in a given case. (There are many data sets available at http://www.energystar.gov but there are many other, conflicting numbers available as well.)
One claim I saw was that electric motors used in elevators accounted for X.X % of electricity use (I forget the exact number, but I do remember the significant digits and implied accuracy!). When I dug deeper in the way this number was determined, it turned out the author had made a very rough guess at the power rating of a “typical” elevator motor, then multiplied that by another rough guess of the number of elevators in use. There was no accounting for the use patterns and duty cycles of these elevators, their loads, the number of floors in the building, and any of the many other factors that affect total energy use. I figured the number as stated had an error band of at least -80 to +100%.
An engineer working out the tradeoffs in system approaches to minimizing energy use while also holding down BOM cost needs solid numbers are essential, or at least some recognition of the fuzziness in the numbers being used. The often cited but misleading numbers and repeated myths have to be examined critically so decisions can be made with good, if not great, data.
What highly precise numbers have you seen that made you shudder? Have you ever been responsible for providing a number with overstated level of confidence or precision?

Subscribe to Newsletter
Test Qr code text s ss